184 lines
11 KiB
Markdown
184 lines
11 KiB
Markdown
---
|
||
title: "Only One Script You Need for Monitor Linux !"
|
||
source: "https://medium.com/devsecops-community/only-one-script-you-need-for-monitor-linux-aa106e883d51"
|
||
author:
|
||
- "[[Karthick Dkk]]"
|
||
published: 2024-10-20
|
||
created: 2024-10-29
|
||
description: "With this script in place, you’ll have one comprehensive solution for monitoring everything on your Linux system. Linux system administrators often face the challenge of monitoring numerous…"
|
||
tags:
|
||
- "clippings"
|
||
---
|
||
[
|
||
|
||

|
||
|
||
](https://medium.com/@karthidkk123?source=post_page---byline--aa106e883d51--------------------------------)
|
||
|
||
[
|
||
|
||

|
||
|
||
](https://medium.com/devsecops-community?source=post_page---byline--aa106e883d51--------------------------------)
|
||
|
||
With this script in place, you’ll have one comprehensive solution for monitoring everything on your Linux system.
|
||
|
||

|
||
|
||
Linux system administrators often face the challenge of monitoring numerous performance metrics, logs, and system health parameters.
|
||
|
||
Traditionally, you’d rely on a variety of tools and scripts to gather data on disk usage, CPU performance, memory status, network traffic, and system logs. But what if you could have **one script** to monitor everything on your Linux system?
|
||
|
||
In this blog post, we’ll show you how to set up a **single monitoring script** that gives you insights into every crucial aspect of your Linux system.
|
||
|
||
From CPU usage to disk space, memory consumption to network activity,
|
||
In this script will provide a one-stop solution for your system monitoring needs.
|
||
|
||
Let’s dive into it!
|
||
|
||
## Why Monitoring Is Critical
|
||
|
||
Monitoring your Linux system is crucial for several reasons:
|
||
|
||
1. **System Health**: Proactively identifying issues before they become critical can help avoid system downtime.
|
||
2. **Performance Optimization**: Monitoring resource usage allows you to adjust your system to ensure peak performance.
|
||
3. **Security**: Regular monitoring helps detect abnormal patterns that could indicate security breaches or attacks.
|
||
4. **Log Management**: Effective monitoring includes tracking logs to troubleshoot any errors or warnings promptly.
|
||
|
||
While there are numerous tools like **top**, **htop**, **iftop**, and **df**, managing multiple monitoring solutions can become cumbersome. With a single script, you simplify your workflow and have a centralized point of reference for your system’s health.
|
||
|
||
## Setting Up a One-Script Solution
|
||
|
||
Before creating the script, let’s outline what it needs to monitor:
|
||
|
||
1. **CPU Usage**: Keep an eye on your system’s processor performance.
|
||
2. **Memory Usage**: Monitor RAM and swap usage.
|
||
3. **Disk Usage**: Ensure that your file systems aren’t getting too full.
|
||
4. **Network Activity**: Track incoming and outgoing traffic.
|
||
5. **Running Processes**: Watch for any rogue or resource-hogging processes.
|
||
6. **System Logs**: Continuously monitor critical log files for errors or warnings.
|
||
|
||
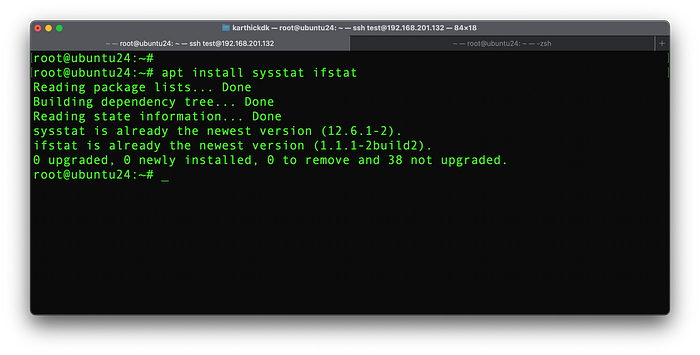
## Install Necessary Packages:
|
||
|
||
```
|
||
sudo apt-get install sysstat ifstat -ysudo dnf install sysstat ifstat -ysudo yum install sysstat ifstat -y
|
||
```
|
||
|
||
|
||
## The Complete Monitoring Script
|
||
|
||
Here’s a comprehensive script that combines all the above metrics into one output. You can schedule this to run at intervals or execute it manually when needed.
|
||
|
||
## Installation Instrcutions
|
||
|
||
```
|
||
sudo mkdir -p /opt/script/
|
||
sudo vim /opt/script/monitoring.sh
|
||
sudo chmod +x /opt/script/monitoring.sh
|
||
/opt/script/monitoring.sh (or) cd /opt/script && ./monitoring.sh
|
||
```
|
||
```
|
||
GREEN='\033[0;32m'
|
||
YELLOW='\033[1;33m'
|
||
RED='\033[0;31m'
|
||
NC='\033[0m'
|
||
echo -e "${GREEN}===== System Monitoring Script =====${NC}"
|
||
echo -e "${YELLOW}\n>> CPU Usage: ${NC}"
|
||
mpstat | awk '/all/ {print "CPU Load: " $3 "% idle"}'
|
||
echo -e "${YELLOW}\n>> Memory Usage: ${NC}"
|
||
free -h | awk '/Mem/ {print "Total Memory: " $2 "\nUsed: " $3 "\nFree: " $4}'
|
||
echo -e "Swap:\n"$(free -h | awk '/Swap/ {print "Total: " $2 ", Used: " $3 ", Free: " $4}')
|
||
echo -e "${YELLOW}\n>> Disk Usage: ${NC}"
|
||
df -h | grep '^/dev' | awk '{print $1 ": " $5 " used, " $4 " available"}'
|
||
echo -e "${YELLOW}\n>> Network Traffic: ${NC}"
|
||
ifstat -i eth0 1 1 | awk 'NR==3 {print "RX: " $1 " KB/s, TX: " $2 " KB/s"}'
|
||
echo -e "${YELLOW}\n>> Top 5 Memory Consuming Processes: ${NC}"
|
||
ps -eo pid,ppid,cmd,%mem,%cpu --sort=-%mem | head -n 6
|
||
echo -e "${YELLOW}\n>> Top 5 CPU Consuming Processes: ${NC}"
|
||
ps -eo pid,ppid,cmd,%mem,%cpu --sort=-%cpu | head -n 6
|
||
echo -e "${YELLOW}\n>> Recent Errors in System Logs: ${NC}"
|
||
journalctl -p 3 -xb | tail -n 10
|
||
echo -e "${GREEN}===== Monitoring Completed =====${NC}"
|
||
```
|
||
|
||
## Breakdown of the Script
|
||
|
||
1. **CPU Usage**: We use `mpstat` to get CPU load, particularly focusing on how much idle time the CPU has. If this value is low, your system is under heavy load.
|
||
2. **Memory Usage**: The `free -h` command gives a human-readable summary of memory and swap usage. High memory usage can indicate an application using excessive resources.
|
||
3. **Disk Usage**: `df -h` shows disk space usage for each partition. Disk space running low can cause performance degradation and system crashes, so this is crucial.
|
||
4. **Network Traffic**: Using `ifstat`, the script monitors the incoming and outgoing network traffic on a specific interface (in this case, `eth0`).
|
||
5. **Top 5 Memory and CPU Consuming Processes**: With `ps`, the script lists the top 5 processes that are using the most memory and CPU, helping you pinpoint resource-heavy tasks.
|
||
6. **System Logs Monitoring**: The `journalctl` the command displays recent errors from system logs, helping you identify issues that might not yet be affecting system performance but are critical to investigate.
|
||
|
||
## Automating the Monitoring Script
|
||
|
||
While manually running this script is useful, it becomes even more powerful when set to run automatically at intervals. You can do this using **cron**, the task scheduler built into Linux. For more about [crontab check out here.](https://medium.com/devsecops-community/day-10-scheduling-tasks-with-cron-jobs-in-linux-e298d17fc0e9)
|
||
|
||
## Method 1: Setting Up a Cron Job
|
||
|
||
To schedule the script to run, say every hour, follow these steps:
|
||
|
||
Open your crontab file:
|
||
|
||
```
|
||
crontab -e
|
||
```
|
||
|
||
Add the following line to schedule the script to run hourly:
|
||
|
||
```
|
||
0 * * * * /path/to/your_script.sh >> /var/log/system_monitor.log
|
||
```
|
||
|
||
This will execute the script every hour on the hour and log the output to a file.
|
||
|
||
*Note: You can the crontab time as per your requirement.*
|
||
|
||
## Send logs to Email via the Command line
|
||
|
||
Now, the server has the logs, but we need to log in and check the files every time, which is not a feasible solution.
|
||
|
||
Let’s automate via Email.
|
||
|
||
## Requirements:
|
||
|
||
1. Postfix — ( [Email configure for linux system check here](https://medium.com/devsecops-community/configure-office-365-email-on-centos-using-postfix-d682ffff6efc))
|
||
2. mailutils
|
||
|
||
```
|
||
# For ubuntusudo apt-get install mailutils -y# For Redhat/Centossudo yum install mailx -y
|
||
```
|
||
|
||
## Method 1:
|
||
|
||
The command below will send our monitoring logs to email. You can change the interval to meet your requirements.
|
||
|
||
```
|
||
0 * * * tail -n 25 /var/log/system_monitor.log | mail -s "Daily Report" -a /var/log/system_monitor.log recipient@example.com
|
||
```
|
||
|
||
## Method 2: Re-write the script directly Send to Email
|
||
|
||
Here’s is alternative script, to send logs directly to Email. Same as the previous one.
|
||
|
||
```
|
||
#!/bin/bashOUTPUT_FILE="/opt/script/monitoring_report.html"echo "<html><head> <title>System Monitoring Report</title> <style> body { font-family: Arial, sans-serif; } h2 { color: #2E8B57; } .section { margin-top: 20px; padding: 10px; } .cpu { color: #FFA500; } .memory, .disk, .network, .processes, .logs { color: #4682B4; } .error { color: #B22222; font-weight: bold; } pre { background-color: #f8f9fa; padding: 10px; border-radius: 5px; } </style></head><body> <h1 style='color: #2E8B57;'>System Monitoring Report</h1> <h2>Date: $(date)</h2>" > "$OUTPUT_FILE"echo "<div class='section cpu'><h2>CPU Usage:</h2><pre>" >> "$OUTPUT_FILE"mpstat | awk '/all/ {print "CPU Load: " $3 "% idle"}' >> "$OUTPUT_FILE"echo "</pre></div>" >> "$OUTPUT_FILE"echo "<div class='section memory'><h2>Memory Usage:</h2><pre>" >> "$OUTPUT_FILE"free -h | awk '/Mem/ {print "Total Memory: " $2 "\nUsed: " $3 "\nFree: " $4}' >> "$OUTPUT_FILE"echo -e "\nSwap:\n$(free -h | awk '/Swap/ {print "Total: " $2 ", Used: " $3 ", Free: " $4}')" >> "$OUTPUT_FILE"echo "</pre></div>" >> "$OUTPUT_FILE"echo "<div class='section disk'><h2>Disk Usage:</h2><pre>" >> "$OUTPUT_FILE"df -h | grep '^/dev' | awk '{print $1 ": " $5 " used, " $4 " available"}' >> "$OUTPUT_FILE"echo "</pre></div>" >> "$OUTPUT_FILE"echo "<div class='section network'><h2>Network Traffic:</h2><pre>" >> "$OUTPUT_FILE"ifstat -i eth0 1 1 | awk 'NR==3 {print "RX: " $1 " KB/s, TX: " $2 " KB/s"}' >> "$OUTPUT_FILE"echo "</pre></div>" >> "$OUTPUT_FILE"echo "<div class='section processes'><h2>Top 5 Memory Consuming Processes:</h2><pre>" >> "$OUTPUT_FILE"ps -eo pid,ppid,cmd,%mem,%cpu --sort=-%mem | head -n 6 >> "$OUTPUT_FILE"echo "</pre></div>" >> "$OUTPUT_FILE"echo "<div class='section processes'><h2>Top 5 CPU Consuming Processes:</h2><pre>" >> "$OUTPUT_FILE"ps -eo pid,ppid,cmd,%mem,%cpu --sort=-%cpu | head -n 6 >> "$OUTPUT_FILE"echo "</pre></div>" >> "$OUTPUT_FILE"echo "<div class='section logs'><h2>Recent Errors in System Logs:</h2><pre class='error'>" >> "$OUTPUT_FILE"journalctl -p 3 -xb | tail -n 10 >> "$OUTPUT_FILE"echo "</pre></div>" >> "$OUTPUT_FILE"echo "</body></html>" >> "$OUTPUT_FILE"mail -s "System Monitoring Report" -a "Content-Type: text/html" recipient@example.com < "$OUTPUT_FILE"
|
||
```
|
||
|
||
## Visualizing Your Data
|
||
|
||
While the script outputs information to your terminal or logs, you may want to visualize the data, especially if you’re managing a production server. For this, you can integrate the script with tools like **Grafana** and **Prometheus**. These tools collect and graph data, giving you an interactive, visual representation of your system’s performance over time.
|
||
|
||
## Enhancing Security with Monitoring
|
||
|
||
System monitoring isn’t just about performance; it also plays a vital role in **security**. For example:
|
||
|
||
- **Log Monitoring**: Keeping an eye on system logs helps you detect suspicious activities like repeated login attempts or unauthorized access.
|
||
- **Process Monitoring**: Watching the processes on your system can reveal malware or unnecessary background tasks.
|
||
- **Network Traffic**: Monitoring incoming and outgoing traffic may reveal abnormal patterns or potential security breaches.
|
||
|
||
Having a single script to monitor everything on your Linux system saves you time and makes the monitoring process more efficient. This approach combines multiple critical system checks into one easy-to-manage script, giving you a quick overview of your system’s health at any given moment.
|
||
|
||
By automating this process with cron jobs and visualizing the data with tools like Grafana, you can ensure that your system is running smoothly and identify issues before they escalate into critical problems.
|
||
|
||
**Helpful Tip**: Customize this script based on your system’s unique needs. You can add other checks, such as temperature monitoring for hardware or I/O statistics for high-performance environments. |